Skip to content
Geo Hound
Browser extension

The GIS data behind any web map. Found, saved, ready to analyse.

Geo Hound spots the map services on a page as you browse, then lets you map, query, and analyse them right in your browser. No DevTools. No desktop GIS required.

Free to install in Chrome or Edge. The detector and workbench are free. The assistant gives you up to 10 free questions a month.
The Geo Hound workbench with several styled council layers drawn over satellite imagery of Auckland, the assistant panel open on the left and a legend on the right.
FIG 01 / WORKBENCH / SAVED SERVICE AS A LIVE LAYER
The old way

You should not need the network tab to find out what is drawing the map.

BeforeOpen DevTools, watch requests, scroll, guess, copy, clean up the URL.
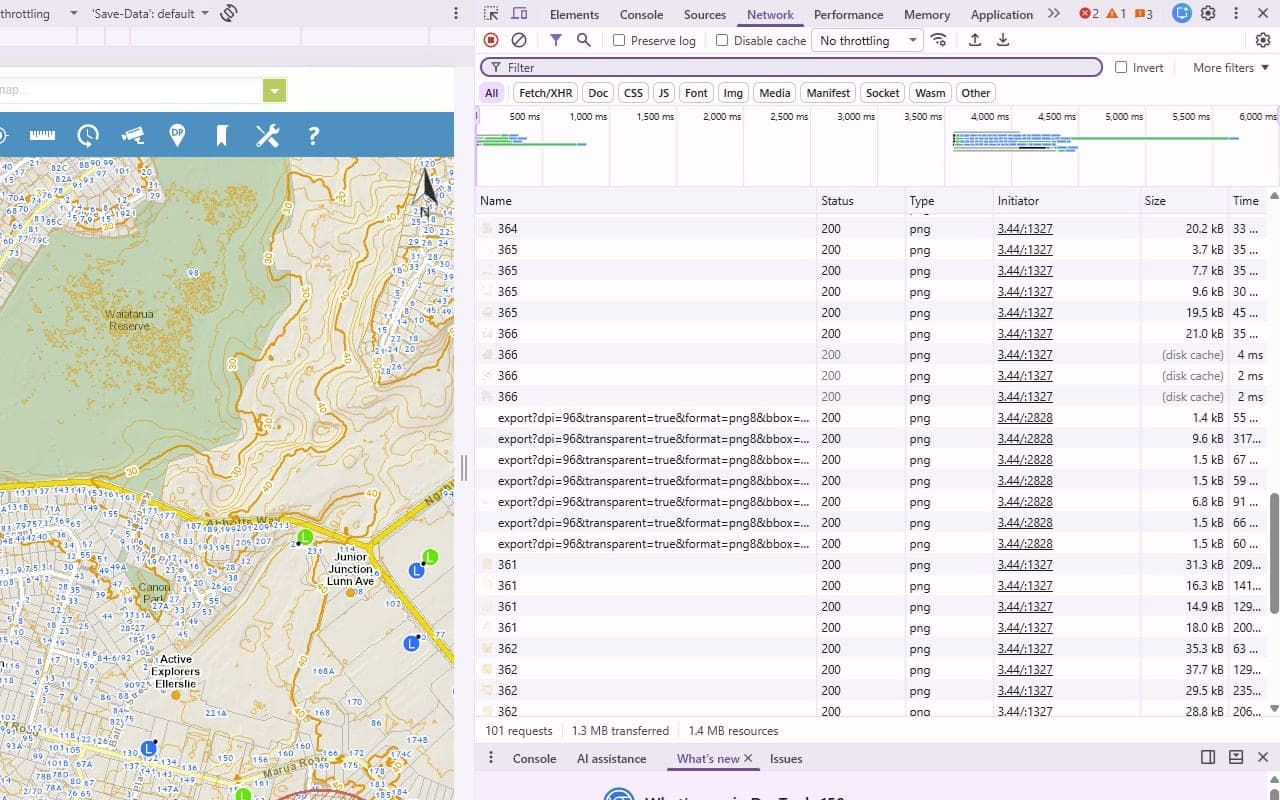
A public map viewer with the browser DevTools Network tab open beside it, showing a hundred-plus tile and export requests you would have to scroll through and decode by hand to find the service URL.
FIG 02a / DEVTOOLS / NETWORK TAB ON A PUBLIC MAP VIEWER
AfterBrowse the map. The services are caught, named, and saved.
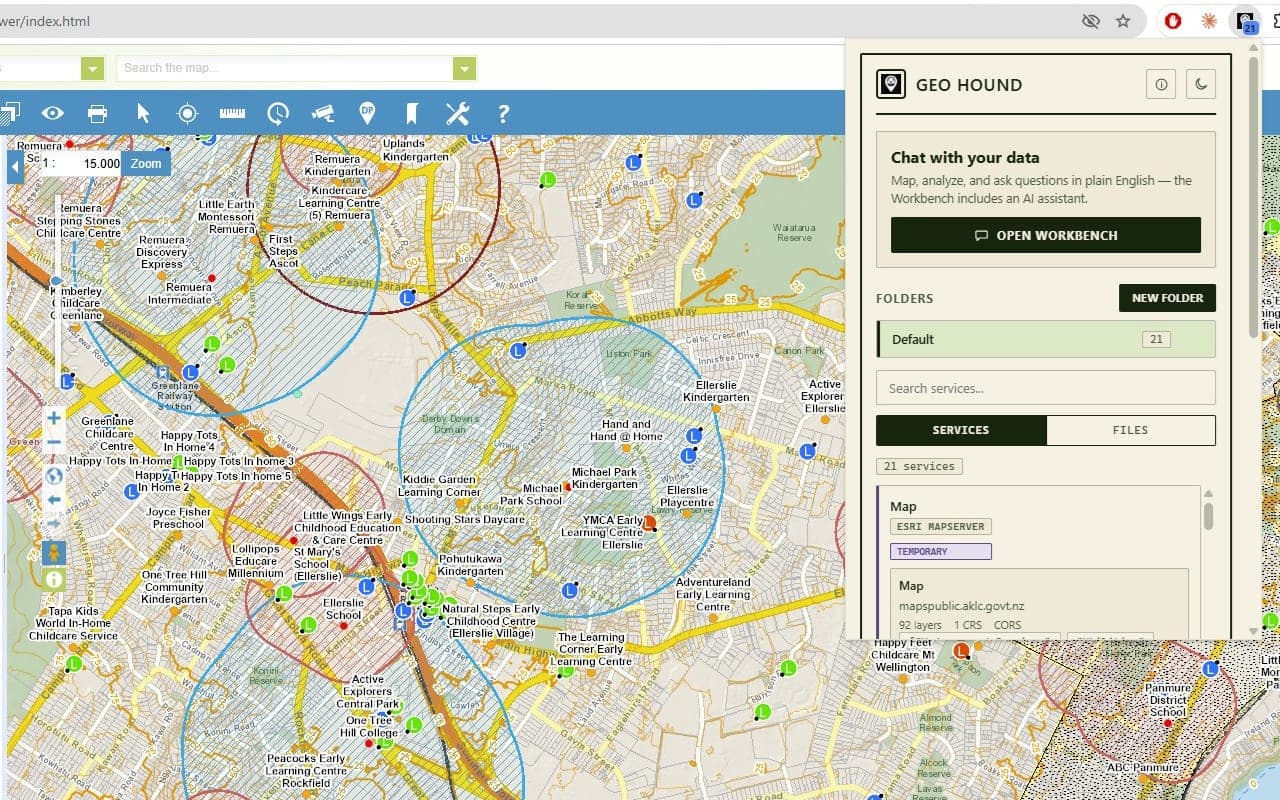
The Geo Hound popup over a street map, listing the GIS services detected on the page in a folder with a count of twenty-one services and a search box.
FIG 02b / GEO HOUND / POPUP WITH DETECTED SERVICES
How it fits together

Three layers, in the order you meet them.

Layer 1 / Detectorfree

It watches the network so you do not have to.

As you browse, Geo Hound reads the traffic and the page for geospatial services and files, and saves what it finds with its metadata. The toolbar badge counts them as they arrive.
  • Detects 29 service and file types, from WMS and FeatureServer to OGC API and GeoPackage.
  • Saves title, provider, layers, keywords, CRS, and bounding box. Sort into folders, search across the lot.
  • Tests CORS, and hands you the URL pre-formatted for QGIS or ArcGIS Pro.
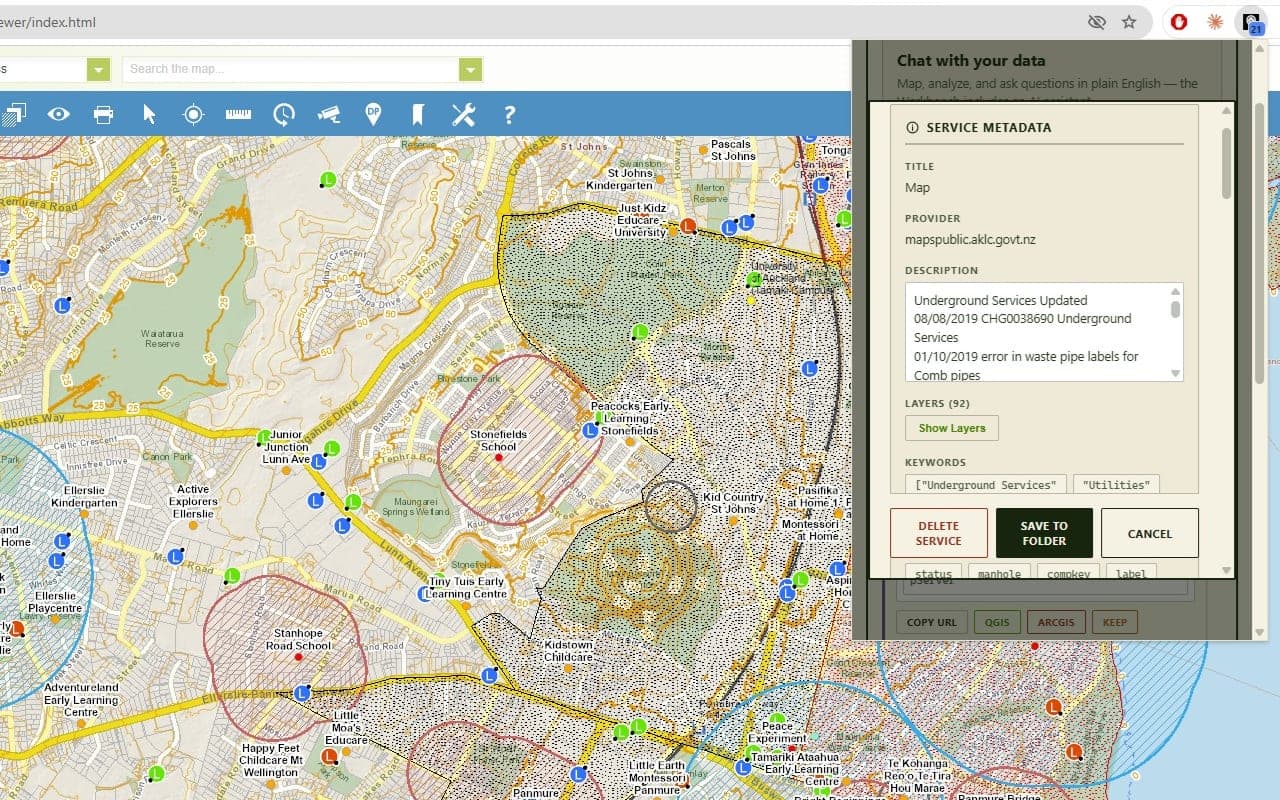
A service metadata panel in the Geo Hound popup showing the title, provider, description, layer count, and keywords for a detected map service, with save and cancel actions.
FIG 03 / DETECTOR / SERVICE CARD, METADATA AND CORS BADGE
Layer 2 / Workbenchfree

A GIS workspace, in a browser tab.

Saved services become live map layers. Import your own files alongside them, then do the work: filter, select, analyse, symbolize, export. Sessions save themselves and come back when you return.
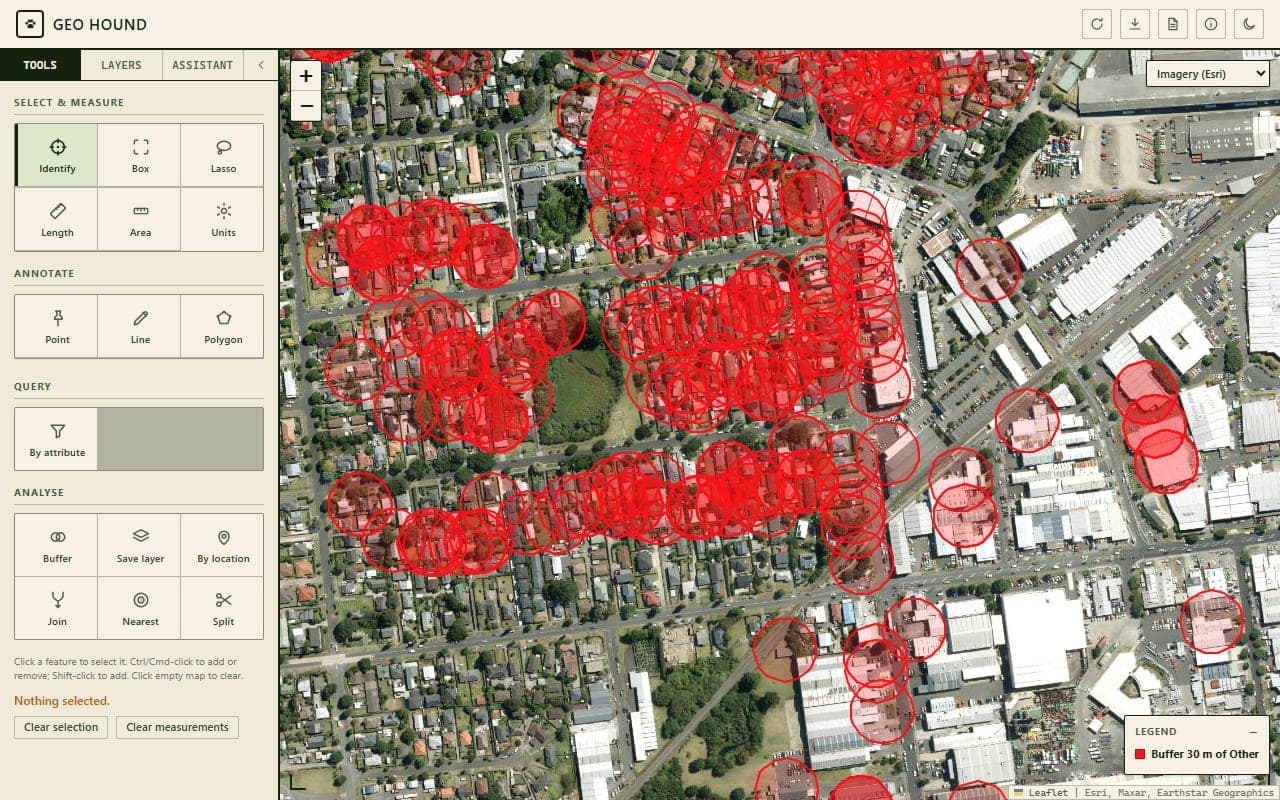
  • Attribute table with an AND/OR filter builder, column stats, and CSV export.
  • Buffer, spatial join, nearest distance, select by location, split multipart. Result layers chain into further analysis.
  • Export to GeoJSON, KML, Shapefile, XLSX, CSV, a PNG map, or a PDF report.
The Geo Hound workbench with the analysis tools open on the left and a buffer result drawn as red rings around features over satellite imagery, labelled in the legend as a thirty-metre buffer.
FIG 04 / WORKBENCH / A BUFFER RESULT OVER IMAGERY
Layer 3 / Assistantup to 10 free a month

GIS analysis for people who do not know GIS software.

An assistant that sits inside the workbench and drives it for you, using 26 tools. You do not need to know what a spatial join is. You just ask the question.
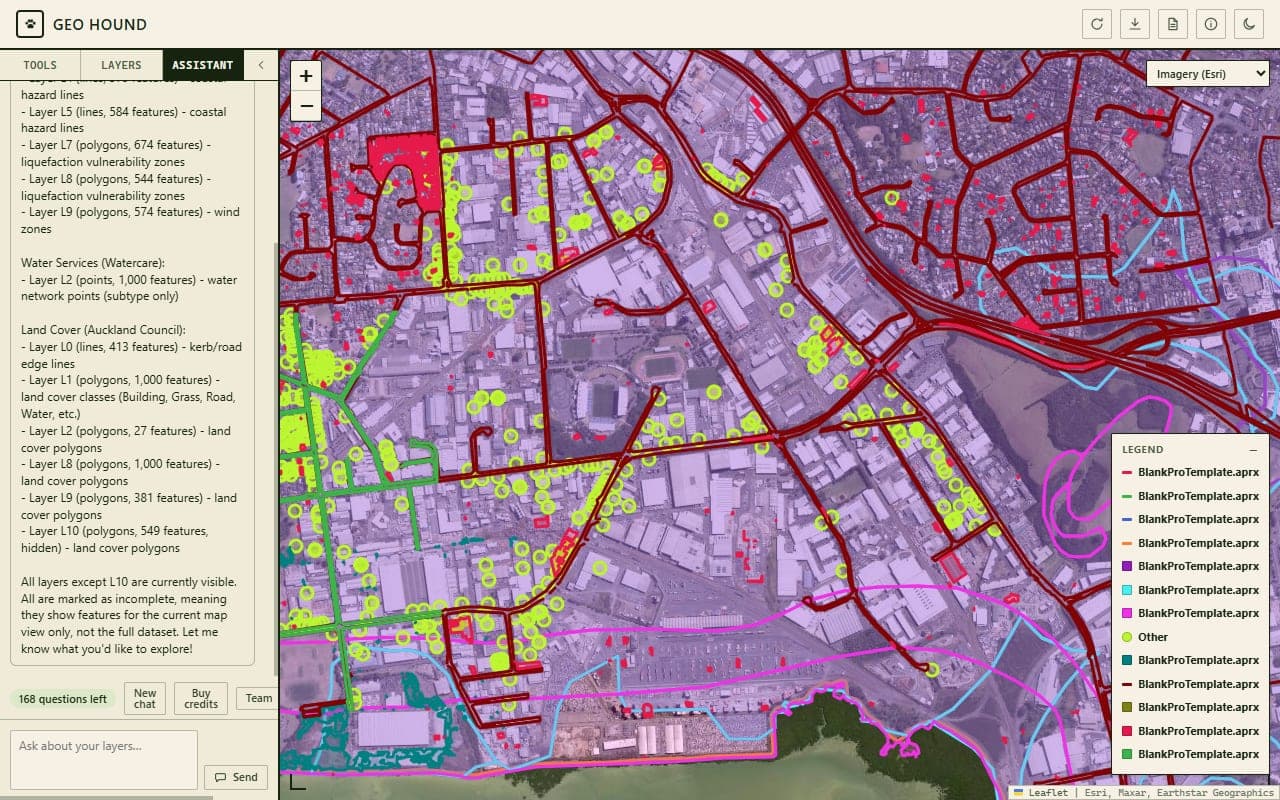
  • Ask in plain English. It queries, buffers, joins, styles, exports.
  • Only layer schemas, counts, and small capped samples are sent to the model. Your datasets are not uploaded wholesale.
  • Conversations are not stored on our servers.
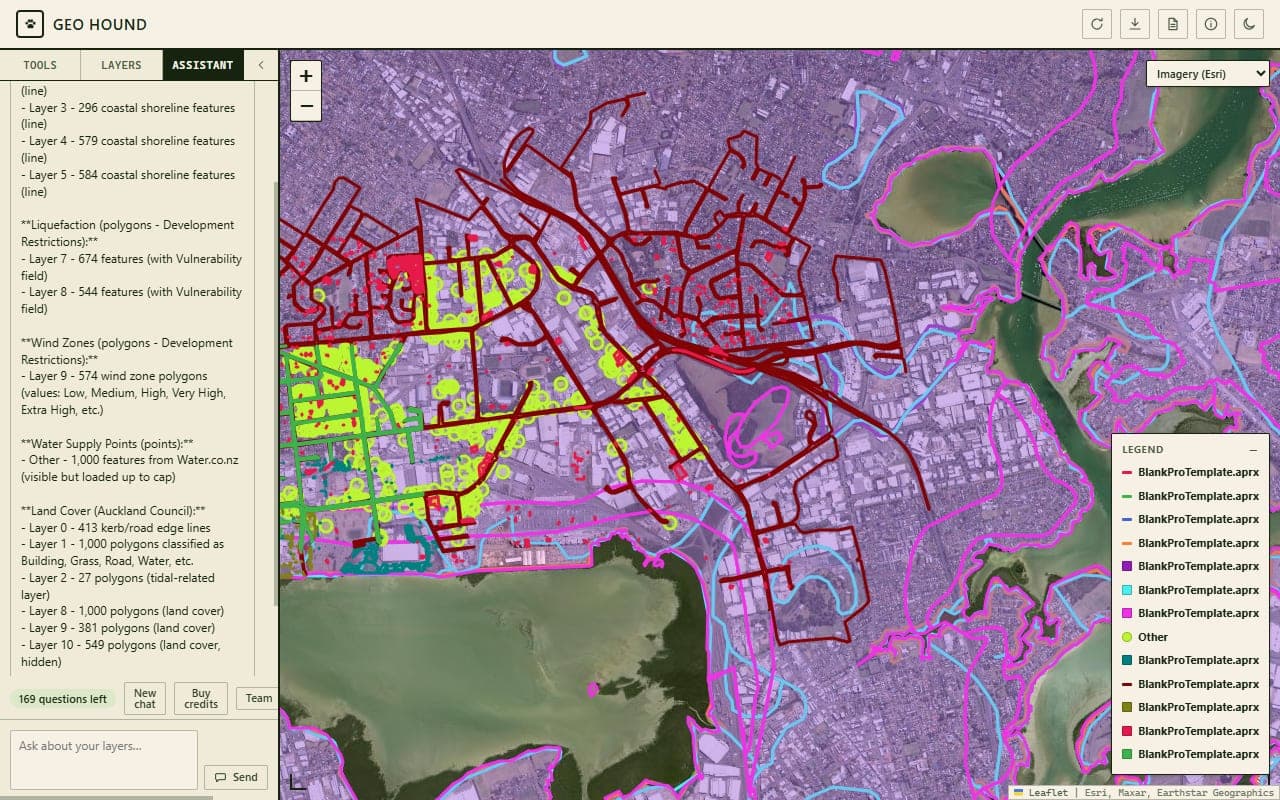
The Geo Hound assistant mid-conversation, summarising the layers it has loaded and their feature counts, beside a map of styled layers over satellite imagery with a legend.
FIG 05 / ASSISTANT / A QUESTION AND THE MAP THAT ANSWERED IT
The assistant

Do not like a colour? Tell it. Need a number? Ask it.

Assistant7 questions left
You

Buffer the wells by 500 metres and tell me how many parcels fall inside.

Geo Hound
  • buffer / wells / 500 m
  • select_by_location / parcels
  • get_statistics / count

Tool steps are free. The question cost 1 credit.

134 parcels fall inside the 500 m buffer. I have added the buffer as a new layer and selected the parcels on the map so you can export them.

Some of what people type. Each one is a real command the assistant can carry out on the data already in front of you.

Styling

Make the flood zones orange and label them by name.

Analysis

Buffer the wells by 500 metres and tell me how many parcels fall inside.

Statistics

Which suburb has the most building consents?

Joins

Join the soil types onto my imported paddock boundaries.

Distance

How far is each school from the nearest fire station?

Export

Select everything inside this polygon and export it as a shapefile.

Navigation

Add a satellite basemap and zoom to my selection.

Read the prompt cookbook

Who uses it

Two audiences, the same public map data.

For GIS pros

A council GIS officer finds the parcels FeatureServer behind a public viewer and has it open in QGIS in one click.

For journalists

A reporter asks which district has the most consented wells on a regional council map, and gets a number and a shaded map back.

For consultants

An environmental consultant buffers streams by 20 metres and overlays a client property boundary imported from KML.

For landowners

A farmer imports paddock boundaries from GPX, joins public soil data onto them, and exports the result as XLSX.

What it catches

29 service and file types, detected as you browse.

OGC services

  • WMS
  • WFS
  • WMTS
  • WCS

OGC API

  • Features
  • Tiles
  • Maps
  • Coverages
  • Processes
  • Records
  • Styles
  • EDR
  • Routes
  • 3D GeoVolumes

Esri ArcGIS REST

  • MapServer
  • FeatureServer
  • ImageServer
  • GPServer
  • GeometryServer
  • GeocodeServer
  • VectorTileServer

Tiles and files

  • XYZ Tiles
  • Vector Tiles
  • Vector Tile Style
  • GeoJSON
  • KML/KMZ
  • Shapefile
  • GeoTIFF
  • GeoPackage
Pricing

Free to install. Pay once, if you ever need to.

  • The detector and workbench are free forever.
  • The assistant gives everyone up to 10 free questions a month.
  • After that, credit packs from $10 for 250 questions. Buy once. They never expire. No subscription.
See pricing
From the maker of the MapScaping Podcast

Geo Hound is a MapScaping product, built by a GIS specialist who got tired of digging through network requests to find the data behind a map.

Read the storymapscaping.com